1 – 9k – Canadian Grand Prix Replay (Wednesday, 19:00)
2 – 8k – Martin Brundle’s How To (Saturday, 14:45)
3 – 5k – British Grand Prix Replay (Friday, 19:00)
4 – 4k – Martin Brundle’s How To (Sunday, 15:14)
5 – 3k – Belgian Grand Prix Replay (Sunday, 10:00)
6 – 2k – Monaco Grand Prix Replay (Tuesday, 19:00)
7 – 2k – Italian Grand Prix Replay (Sunday, 16:00)
8 – 2k – German Grand Prix Replay (Saturday, 10:00)
9 – * – Inside Track: Pastor Maldonaldo (Sunday, 15:30)
10 – * – European Grand Prix Replay (Thursday, 19:00)
A star for anyone wondering is when BARB records a viewership for that particular programme of zero.
Aside from looking at both the BBC F1 and Sky Sports F1 teams and their respective programming, a key component of this blog in 2012 has been to look at the ratings picture for every individual race. The ratings picture in 2012 has been haphazard thanks to the deal between BBC and Sky, some races have been wildly up and some have disappointed, but overall it is possible to draw some conclusions and bring together averages which I intend to do in this blog.
Before we get into figures, the main figures I use are programme averages. Why? Because they are the most widely available – especially when you are looking at historical Formula 1 figures from say ten years ago. Not every article will attach a ‘race average’ to it. However, I have done some calculations of my own using viewing figures that I have – which I will explain further later. All figures for 2012 comprise of one of the following, where appropriate:
– Sky live and BBC highlights
– Sky live, BBC live and BBC re-run (Asian based races)
– Sky and BBC live (non-Asian based races)
In August, I noted that Formula 1 in 2012 was set to be the lowest rated since on UK television since 2008. That prediction turned out to be true. Furthermore, analysis shows that there are 500,000 viewers that are not tuning into BBC highlights weekends that would otherwise tune into BBC live weekends.
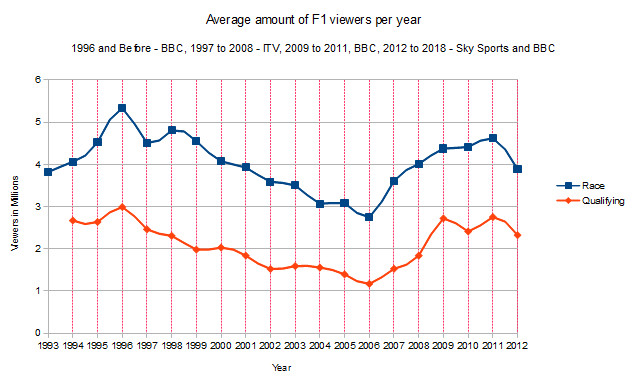
Below are the season averages, based on full programme broadcasts:
– 2006 – 2.75 million
– 2007 – 3.61 million
– 2008 – 4.01 million
– 2009 – 4.38 million
– 2010 – 4.41 million
– 2011 – 4.62 million
– 2012 – 3.89 million (or 4.10 million using the ‘35 percent theory‘)
You may note some minor differences in the viewing figures above versus the ones I published in August. The reason for this is because all the figures from 2006 to 2012 now that I use are consolidated figures (which take into account anyone who has watched within 7 days) whereas before it was a mixture of overnight ratings and consolidated ratings. You will also notice that the 3.89 million figure for 2012 is the lowest since 2007. This is where the ’35 percent theory’ that I explained in August comes back in. When comparing to previous years, the BBC F1 programme started at 12:10 and ran to about 15:15. Sky Sports F1 live programmes ran from 11:30 to 16:15 meaning that the total average for Sky Sports F1 would be artificially deflated as a result. Applying the ’35 percent theory’ on top of the Sky figures gives you the 4.10 million average above. When both BBC and Sky are live, the average for those ten races is 4.38 million viewers. When only Sky are live and when BBC are showing highlights, that figure drops to 3.88 million viewers. Only twice for those ten races has the programme average been above 4 million, Bahrain and Hungary. The remaining eight races with exclusive Sky coverage recorded a average of under 4 million viewers. I would be questioning why that is the case, a 500,000 viewer difference between the two feels significant to me and appears to prove that the majority of fans still prefer to see Formula 1 in 2012 live.
Whilst the change in Formula 1 broadcasting for 2012 is one reason for the overall drop, it is not the only reason. The Olympics is another reason, as is Euro 2012 and Wimbledon. All three sporting events have hit Formula 1’s ratings this year. Formula 1 was always going to be hit by the Summer of Sport. But would the 2012 season have faired better if every race live on the BBC? Absolutely, and I think the fact that the average when races were live on BBC is 500,000 higher than when they were exclusively live on Sky proves that. BBC have every possible way of promoting sporting events – radio, TV, interactive, online. Formula 1 would remain in the limelight and would not become a forgotten sport for the Summer. I think the average would have been down on previous years, but it would have remained well above 4 million viewers in my opinion, near to 2010 levels.
Figure 1.1.
The drop for 2012 is disappointing. But things need to be kept in perspective, Formula 1 is still immensely popular in the UK, and we are not going back to the mid 2000’s, where Formula 1 was struggling to achieve over 3 million viewers as Figure 1.1. above shows. The ratings should rebound in 2013 – no Olympics and no European Championship’s means that Formula 1 has weaker competition next Summer. If viewing figures do not rebound, then questions must be asked whether the BBC and Sky deal was a worthwhile deal for the money-makers to enter into. It also brings up the question of BBC Sport’s Formula 1 team extremely dedicated and hard work across these past few years in increasing the popularity of Formula 1 after the Schumacher years only for those higher up at the BBC to flush over half a million viewers down the toilet.
I noted during my August blog that I hoped the the season average would increase. At the Summer break, the 2012 season was averaging 4.14 million viewers. That figure has dropped very slightly by 40,000 viewers. Not a large drop, but a slight drop for whatever reason. A worrying statistic for me is that only four races seen their figures increase versus 2011. They were Brazil (up by 1 million), Italy, China and Europe. Two races were not on the calendar in 2011, meaning that fourteen rounds seen their figures drop versus 2011. Whilst some rounds clashed with other sporting events, I am fairly certain that does not apply for every one of those fourteen rounds. Canada unsurprisingly recorded the biggest drop versus 2011, whilst Japan and India also recorded sizeable drops. 2013 should see an automatic increase in significant numbers for Canada as the race will be live on BBC One.
The 4.38 million average for the BBC and Sky live races is an average I would have expected overall if BBC was showing every race live. There is an argument – and this applies for every race – that the 520,000 viewers drop is purely due to Sky’s longer airtime as there is a higher viewership for Sky when they are live, hence more weighting on their ratings. That is a completely false assumption to make due to the fact that I have already equalised the ratings as demonstrated above. Using consolidated figures and 5-minute breakdowns, The F1 Broadcasting Blog has taken averages from seven races across the past seven years and calculated the overall averages. Those races are Monaco, Spain, Britain, Belgian, Singapore, Abu Dhabi and Europe. The average is from race start to chequered flag only. The results are as follows:
Race averages (Mon, Spa, UK, Sin, AbD, Eur)
– 2006 – 2.92 million (32.4%) (exc. Belgium, Singapore and Abu Dhabi)
– 2007 – 4.09 million (36.5%) (exc. Singapore and Abu Dhabi)
– 2008 – 4.57 million (37.9%) (exc. Abu Dhabi)
– 2009 – 4.95 million (43.9%)
– 2010 – 5.61 million (43.5%)
– 2011 – 5.58 million (43.7%)
– 2012 – 5.03 million (38.4%)
The conclusion that there has been a viewership drop is unquestionable. Those seven races were all BBC and Sky live races, and the race average is again in the lowest since 2009 – a similar story to the 4.38 million programme averages. Qualifying in 2012 has fared well, averaging 2.32 million viewers. Whilst it is down on 2009, 2010 and 2011 – it does stand in-line with 2010’s average of 2.41 million viewers which itself was affected by a Summer dominated by sport.
Focussing on Sky only to end the piece, live coverage of practice 1 has averaged 65,000 viewers; practice 2 has averaged 75,000 viewers; practice 3 has averaged 94,000 viewers. All three of those numbers have dropped off compared to the where they were at the Summer break, possibly suggesting that viewer fatigue had set in for the latter stages of the season. The F1 Show, when on location at race weekends, has averaged 45,000 viewers. I’ve covered my thoughts on those figures before and the main conclusion is that those figures are extremely low and below Sky’s own expectations. The GP2 Series and GP3 Series on Sky Sports F1 have also fared poorly, both averaging below 100,000 viewers. In my opinion that is due to the lack of advertising that Sky give to the feeder series’, neither series have had adverts promoting them on Sky so it is little wonder to see either series struggle for viewers on the channel. It is worrying that the stars of the feature are being seen by what feels like ‘one man and a dog’, GP2 and GP3 definitely need more of a prominent status here in the UK for 2013.
Several weeks on, and nearly 15,000 words later, that is my 2012 Verdict. Due to reasons already explained, I had hoped to have finished the verdict before Christmas but in any case, I hope you’ve enjoyed reading the pieces and as always, comments are welcome. Roll on 2013!
Note: All the figures quoted here are the averages for the whole race programme, not the race average unless stated. Figures are mostly official figures from BARB and Broadcast magazine. While I have made comparisons and analysis of figures, I should note that I do not have every single ratings figure. The figures for that races that I am missing are:
1992 – Australia, San Marino, France, Portugal, Japan (live and both for AUS, JPN)
1993 – France (live), Japan (highlights)
1994 – Pacific (highlights), San Marino, France, Hungary, Japan (live)
1995 – Australia, Argentina, San Marino, Spain, Japan (all live)
1996 – Canada, Japan (all live)
1997 – Japan (live)
1998 – Australia,France, Japan (all live)
2000 – Malaysia (live and re-run), Japan (live)
2001 – Japan (live)
2003 – Malaysia; Japan (both live)
2004 – China (live)
If anyone is reading and has any of them ratings, leave a comment. While this piece focusses primarily on the 2012 ratings picture, my April piece focussed on the ratings picture for the past twenty years. For anyone wishing to read that, please click here.
1 – 6k – Legends (Saturday, 14:30)
2 – 6k – Legends (Saturday, 15:30)
3 – 5k – Brazilian Grand Prix Highlights (Friday, 21:00)
4 – 4k – Abu Dhabi Grand Prix Highlights (Thursday, 21:00)
5 – 3k – Malaysian Grand Prix Replay (Saturday, 16:00)
6 – 3k – Belgian Grand Prix Highlights (Monday, 21:00)
7 – 3k – Bahrain Grand Prix Replay (Sunday, 16:00)
8 – 2k – Korean Grand Prix Highlights (Wednesday, 21:00)
9 – 2k – Chinese Grand Prix Replay (Sunday, 10:00)
10 – 1k – Legends (Saturday, 18:00)
I was not expecting a BARB update today, but in any case very low ratings now we are firmly in the off-season and presumably their lowest ever weekly reach with a reach of 234,000 viewers. Over on Motors TV, the Race of Champions had official ratings of 18,000 and 23,000 viewers, up marginally on the overnight ratings, although it was not the highest ratings on the channel, that honour going to the Macau Motorcycle Grand Prix which had 34,000 viewers.
Before the start of the 2012 season, back in January, Sky Media released an sponsorship pack for potential sponsors to sponsor the new Sky Sports F1 channel. As we know, Santander became the sponsor of Sky Sports F1, however, the partnership only lasted a season.
The result of the split between Sky and Santander means that a new sponsorship pack has been released by Sky, as I mentioned yesterday. The interesting thing here is that there is a new ‘Estimated Audience Delivery’ table, which means different numbers so we can see how Sky’s pre-season ratings predictions stack up with their 2013 predictions, which I assume is their real 2012 ratings.
Firstly it is worth mentioning what is meant by TVR. To quote from the Attentional glossary: “TVR: Television Rating. This is the audience of a programme or daypart expressed as a percentage of the population as a whole. For examples, an Adults 16-34 TVR of 20% for EastEnders means that 20% of all 16-34’s living in UK television households watched that programme.” So in January 2012, Sky predicted that 1.34% of the ‘Individual’ universe would watch Sky for the live exclusive races. For the sake of this blog, I have converted the TVR’s into raw viewing figures using that particular total Universe population.
Secondly, some words are abbreviated in the 2012 pack, so to help:
– INDS = All individuals
– ADS = Adults aged 16 and over
– ABC1 ADS = Adults aged 16 and over that fall into the ABC1 demographic category
– ABC1 MEN = Men aged 16 and over that fall into the ABC1 demographic category
– MEN = Men aged 16 and over
Because Sky Media has not included the ‘ABC1 ADS’ category in the 2013 pack, it is impossible to gather any meaningful data from that, as thus, it is ignored for this blog.
The headline figures are of course the race figures. And on the whole, the 2013 figures have been revised upwards from their 2012 predictions. In their 2012 pack, Sky predicted 288,000 individual viewers for each of the shared races. They’ve quite comfortably had nearly double of that figure so it is little surprise to see the 2013 figure adjusted. They have also outdrawn their 2012 race predictions in the three key demographics (Adults, ABC1 Men and Men) and as thus, all three see a rise for 2013.
The only figure that Sky have had to adjust downwards for the race is the total audience for when they are the only broadcaster live, which seems a bit of an odd one when all of the major demographics have gone upwards. This suggests that the audience is skewing older than expected (hence the rise is Adults and Men), meaning that they are missing a lot of the audience under 16.
Exclusive races (2012 prediction vs 2013 prediction) Individuals – 773,000 vs 598,000 Adults – 457,000 vs 564,000 ABC1 Men – 174,000 vs 184,000 Men – 326,000 vs 336,000
The qualifying figures are a tale of two halves. When the coverage is shared with BBC, Sky are doing better than anticipated, but when they are screening the coverage exclusively live, they are not bringing in the younger audience. Looking at BBC’s audience, they are struggling to bring in a young audience as well, for the Brazilian Grand Prix, only 285,000 viewers were under 16. I think Sky were hoping that the launch of the Formula 1 channel would help bring a young audience to watch Formula 1 but that has not happened.
Exclusive qualifying sessions (2012 prediction vs 2013 prediction) Individuals – 646,000 vs 333,000 Adults – 383,000 vs 314,000 ABC1 Men – 144,000 vs 103,000 Men – 274,000 vs 193,000
For me, though, the major ouch comes with the figures for practice and The F1 Show. In their 2012 pack, Sky predicted an average of 213,000 viewers for practice and 167,000 viewers for The F1 Show. Those of you who read my weekly top ten’s for Sky Sports F1 will know that neither of those two targets have been hit. Their revised 2013 prediction for practice is 80,000 viewers, whilst Sky predict that only 17,000 viewers will watch each episode of The F1 Show in 2013. The practice figure is just over a third of the 2012 prediction, whilst The F1 Show has only achieved 10 percent of what was anticipated back in January. I’ve stated before that I believe The F1 Show is the best part of the Sky Sports F1 portfolio at the moment, but that does not hide the fact that the viewing figures are disastrously low. The 2013 sponsorship pack confirms that The F1 Show will return for 2013, so we shall see if the figures do improve.
I think the conclusion here is that on one hand, Sky will be extremely pleased that they are doing better than expected when live on air with BBC, but on the other hand they will be somewhat disappointed that their exclusive coverage, in particular The F1 Show is not bringing in as many viewers as they expected.
Live coverage of the Race of Champions event from Thailand on Motors TV peaked with 44,000 viewers, overnight viewing figures show.
Saturday’s coverage averaged 13,000 viewers (0.11% share), peaking with 42,000 (0.36% share), whilst Sunday’s coverage from 13:00 to 16:00 averaged 23,000 viewers (0.21% share), peaking with 44,000 viewers (0.34% share). Both peaks occurred at the climax of the proceedings at 15:40.
Obviously while the raw figures are low, when you compare them to Sky Sports F1’s other programming, the figures hold up very well. The figures are also significantly above Motors TV’s usual Sunday figures, last Sunday (9th December) the channel recorded zero viewers for the majority of that afternoon, whilst Sky Sports F1 also recorded zero yesterday afternoon.